How answering People Also Ask questions correlates with organic rankings (Study)

Table of contents
Disclaimer: This is an independent study conducted by Chris. AlsoAsked provided complimentary API credits to supplement his paid account for this research, but we had no say in the methodology, data analysis, or final results.
Understanding user needs is critical for search engines, LLMs, and every industry that relies on these platforms to get in front of audiences. A huge part of this is understanding the questions users want answered.
But, discerning the full intent driving a user with just the keyword they searched is a challenge—words have different meanings, people don’t know exactly what they’re looking for, or sometimes do not articulate their needs that well.
It is now the search engines/LLM’s job to simultaneously read minds and judge what content answers those questions and (more recently) preempt the subsequent questions/queries. So, if you know (or can predict) the questions users will ask, you can understand what content is the most valuable.
A lot is being written right now about how SEOs can potentially simulate some of these more sophisticated methods of synthesising questions (i.e., ‘query fan-out’ from Google’s AI Mode). But I think we have an even more accessible proxy than that—People Also Ask (PAA) questions.
If we take a seed keyword, build a list of potential questions related to that search term, and then judge the ranking websites against how well they answer those questions, can we learn more about the value of this approach?
Takeaways
- Across the top 5 positions, pages that fully answer more PAA questions tend to rank higher.
- Commercial and transactional queries show the strongest correlations; navigational and informational queries are weaker.
- Beyond page 1, the correlation drops sharply and can even reverse in lower page 2 positions—likely due to small sample sizes and SERP variability.
- Answering PAA questions alone isn’t enough to rank well; technical quality, external signals, and user experience still matter.
- Covering a wide range of related questions can make content semantically richer, which may support ranking potential.
Methodology
Armed with AlsoAsked, SerpAPI, and OpenAI’s API, I think we can explore the correlation between rankings and PAA questions answered. Here’s how:
- Start with a list of seed keywords.
- Fetch the top 20 organic results.
- For each keyword, check PAA questions using the AlsoAsked API.
- For each organic result, extract the main readable content.
- Send the content and each question to GPT-3.5 Turbo, asking, “Does this page answer this question? Fully, partially, or not at all?”.
This enables us to see:
- The number of PAA questions answered by results ranking within the same SERP.
- Whether the number of PAA questions answered correlates with rankings.
- How all of the above is impacted by search intent.
Note: During this study, I found several areas that I could improve upon in the future. You can find those opportunities and caveats following the conclusion section of this study.
The detailed process
If you want to replicate this study, I’ve covered the major portions of the process below:
- Keyword selection
- Working pipeline
- API specifics
Keyword selection
For this test, I needed a significant number of keywords to smooth over potential biases or low-level data issues. I conducted this test using:
- 563 keywords
- 4 search intent stages
- 3 niches
The keywords were seeded per niche using the DataForSEO’s Keyword Ideas API input, so they were broadly related, essentially random, and grouped around the four standard intent stages (informational, navigational, commercial, and transactional).
Intent | Keywords | Questions | URLs |
|---|---|---|---|
Intent Commercial | Keywords 142 | Questions 2274 | URLs 1470 |
Intent Informational | Keywords 139 | Questions 2213 | URLs 1455 |
Intent Navigational | Keywords 137 | Questions 2282 | URLs 1443 |
Intent Transactional | Keywords 145 | Questions 2249 | URLs 1580 |
Intent Grand total | Keywords 563 | Questions 7905 | URLs 5415 |
Working pipeline
To conduct my analysis, I followed the steps below:
- Preparation and setup
- Connect to data services by API.
- Build a list of seed queries (keywords) to research.
- For each keyword (seed query)
- Load AlsoAsked related questions for each keyword.
- Get Google results — Uses the SerpAPI to fetch the top Google search results for that keyword.
- For each result URL
- Extract main content: Uses a browser (headless Chrome) to load the page and extract the main readable text using a ‘readability’ API.
- Extract main content: Uses a browser (headless Chrome) to load the page and extract the main readable text using a ‘readability’ API.
- If content is insufficient (too short or missing), skip the page.
- For each question
- Send the extracted content to GPT-3.5 Turbo and prompt it to evaluate whether the content answers the question “fully”, “partially”, or “not at all”, and provide reasoning for its answer.
- Record results and store the status and reasoning for each keyword, question, and URL.
- Save all results for each keyword and save the collected results into a CSV file.
- Logging and error management
- Log any errors (API failures, extraction issues, etc.) with timestamps for troubleshooting later.
API specifics
If you want to replicate this yourself, here (or conduct similar research) here are the specifics around the APIs used for the pipeline.
- SerpAPI fetches organic URLs from the top 20 results.
- OpenAI’s GPT-3.5 Turbo is more than adequate for the task at hand, whilst keeping costs manageable.
- AlsoAsked fetches to a depth of 20 questions to keep them closely associated with the seed term, whilst not being too limiting.
Results
The results below show the number of questions answered by the top 20, 10, and 5 positions across the four intent stages.
For further analysis, I conducted the same test with partially answered questions (using a ‘question score’). The results of that analysis are below as well.
Questions answered by position
Questions answered by intent top 20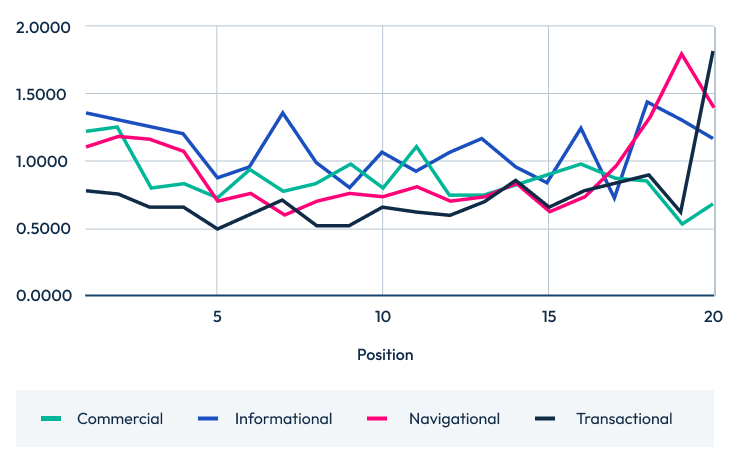 Questions answered by intent top 10
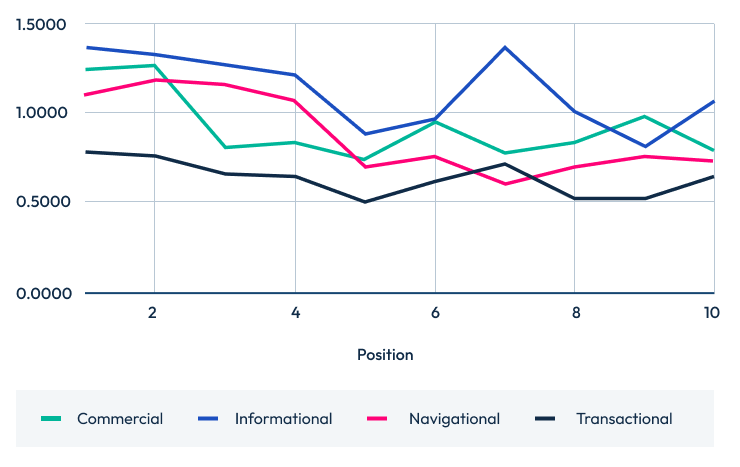 Questions answered by intent top 5
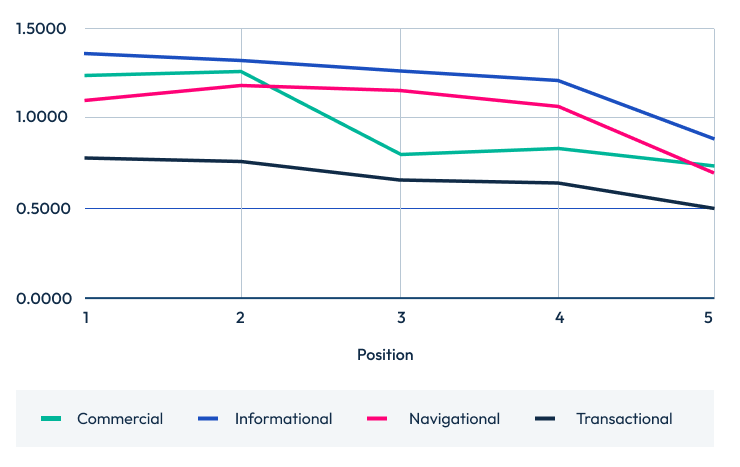
Because this methodology is binary (the content either does or doesn’t answer the question), we’re potentially writing off a lot of half-answered questions, which are valuable if there is no better answer.
Question score by position
Rather than only using a simple yes/no approach, I also assigned points based on whether a question is wholly or partially answered to see how this might play into search rankings:
- Answered "yes" = 1pt
- "partial" = 0.5pts
- "no" = 0pts
This gives less credit to partially answered questions, but may help us see if we’re missing any nuance.
Questions score by intent top 20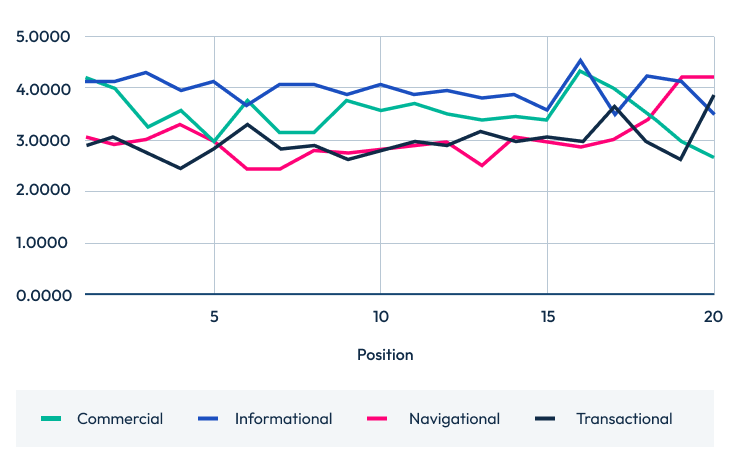 Questions score by intent top 10
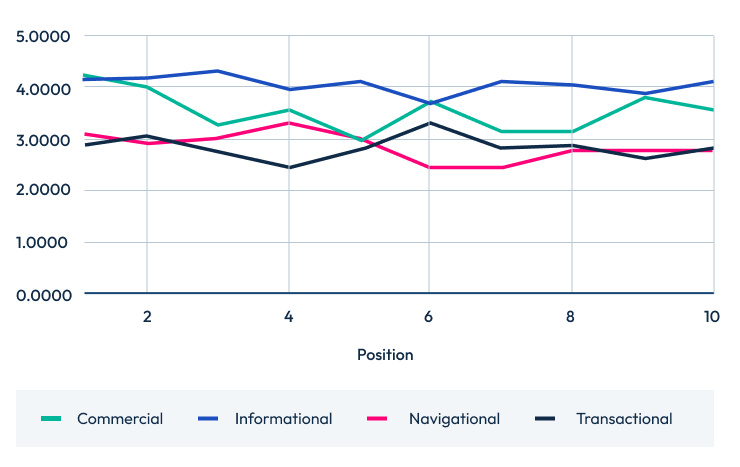 Questions score by intent top 5
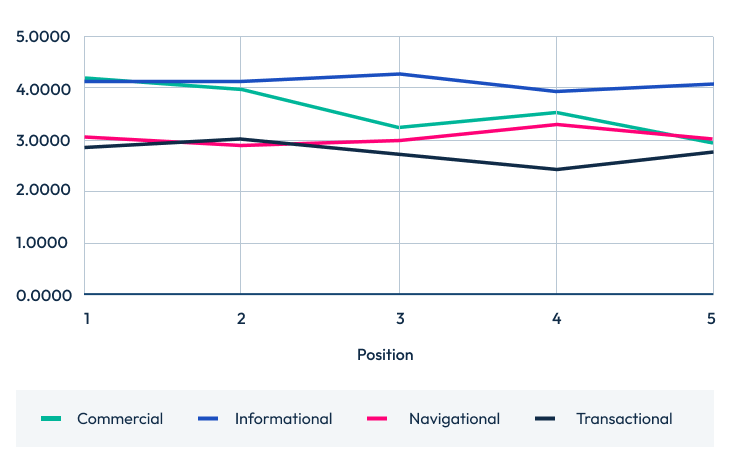
How do questions answered/question score correlate with ranking position?
Here’s how questions answered correlates with ranking position for the top 20, 10, and 5 search positions.
(Note: As the positions descend but the averages ascend, it means a negative correlation is actually a good thing.)
How questions answered correlated with ranking position
Intent | Top 20 | Top 10 | Top 5 |
|---|---|---|---|
Intent Commercial | Top 20 -0.4851 | Top 10 -0.5683 | Top 5 -0.8941 |
Intent Informational | Top 20 -0.1246 | Top 10 -0.6226 | Top 5 -0.8867 |
Intent Navigational | Top 20 0.2472 | Top 10 -0.8213 | Top 5 -0.7414 |
Intent Transactional | Top 20 0.4532 | Top 10 -0.5999 | Top 5 -0.9573 |
And, here’s how they correlated when I used the question score method.
How question score correlated with ranking position
Intent | Top 20 | Top 10 | Top 5 |
|---|---|---|---|
Intent Commercial | Top 20 -0.2393 | Top 10 -0.3806 | Top 5 -0.9097 |
Intent Informational | Top 20 -0.3027 | Top 10 -0.4463 | Top 5 -0.4364 |
Intent Navigational | Top 20 0.4979 | Top 10 -0.5513 | Top 5 0.1745 |
Intent Transactional | Top 20 0.4482 | Top 10 -0.1241 | Top 5 -0.5460 |
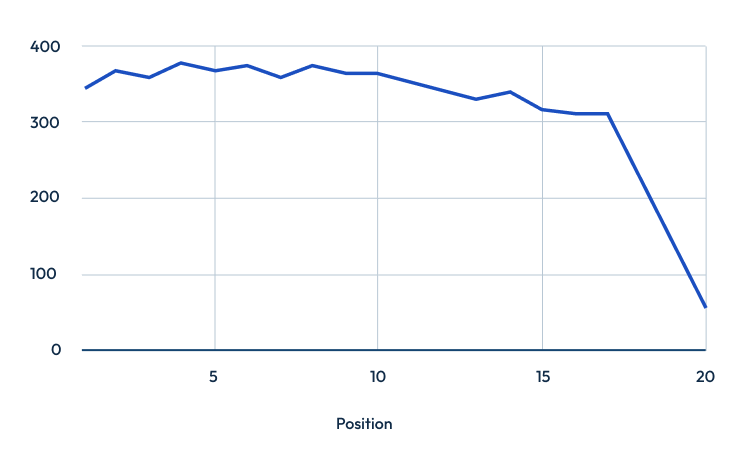
One striking pattern is that the correlation scores climb when we look at the top 20 positions. It’s also worth noting that we have far fewer results recorded from the bottom of page 2. The change in average could be impacted by a lower number of results skewing overall averages.
Key findings
Across the top 5 organic search positions, there is a strong, positive correlation between the number of fully answered questions and ranking.
When I introduced question scoring (which accounts not only for fully answered questions, but also for partial or in-depth snippets) it added useful nuance to the analysis. However, its correlation with rank is weaker than the raw ‘questions answered’ metric. This suggests that, while partial coverage and depth matter, outright completeness appears to be more important.
For navigational queries (i.e., where users seek a specific site or page), the relationships weaken further. There is still a clear trend, where higher questions-answered counts and stronger question scores tend to align with better rankings, but neither metric has as much influence here as it does for other intent query types.
Surprisingly, informational queries don’t display the strongest correlations (despite my expectation that thoroughly informative content would naturally answer more questions). Several factors could be at play, but our sample size makes me reluctant to make any solid conclusions. It is also possible that there are more questions at play, or perhaps that answering fewer, more specific questions is more significant than a breadth of answers.
Finally, beyond the first page—and especially in the lower slots of page 1 and throughout page 2—the link between either metric and ranking diminishes sharply. By the bottom half of page 2, the trend even reverses: pages with fewer answers or lower question scores sometimes rank better.
Part of this anomaly stems from a statistical element, because positions 18–20 appear less frequently in the dataset, each additional answered question (full or partial) disproportionately inflates the average, creating a misleading spike in the ‘questions answered’ metric without reflecting a real ranking advantage.
Answering questions is crucial, but you still need a robust user experience and external quality signals
It seems as though questions answered correlate with ranking position—specifically with regard to the top 5 positions. This may not necessarily be because a number of questions is answered on the page, but because you are covering a lot of the subject with the content that could lead to a positive experience for the user. Clearly covering questions around an area makes that page semantically richer, too.
More time spent on crawling, scraping, and analysis would likely yield more complete results, but the directionality of the results would be the same. EVERY step of this process (keyword selection, niche selection, intent designation, and analysis) would likely have more of an impact on results, so if we wanted to be more concrete, we would need to significantly increase the number of keywords, ensure the pipeline is more robust, and create a more nuanced view of the intent stages.
Put simply, if you take ALL the PAAs for a niche, answer all those questions, you STILL need to have stronger technical standards, well written copy, external quality signals, and evidence of user satisfaction to rank well. So in isolation answering PAA questions is not enough, but it could be a significant factor when all are compared.
Methodology: Room for improvement
Below are some obstacles that I was not able to completely navigate during the first iteration of this study:
- Readability errors — Some pages may not extract correctly (due to paywalls, heavy JS, or unusual layouts).
- Low-content filtering — Skips any page with <100 words, which might discard pages that answer succinctly.
- Bot/scraping protection — Some websites actively block or serve different content to bots or headless browsers.
- There’s no built-in manual review to check if ChatGPT 3.5-Turbo’s answers are accurate.
- If a top Google result can’t be scraped or the content is empty, that result was ignored.
- If the questions can’t be loaded (i.e., because there are none), that keyword was skipped for the gap analysis.
- A lot of sites (Youtube, Spotify, etc.), do not have content to scrape in the same sense for this kind of analysis. So for this, they are judged to not answer a question, even if they may have.
Some more general caveats about the integrity of the data itself, keyword selection, and potential risks in using LLMs include:
- Correlation is not causation — Answering questions might not cause high rankings, but could be a side effect of good content.
- SERP features bias — Featured snippets or People Also Ask boxes themselves might affect which pages get selected and ranked.
- Sample bias — If the keywords/questions aren’t representative, it may not be appropriate to generalize results.
- Reliability of “answer status” — As mentioned before, LLM judgment is strong, but not perfect.